The business needed a trusted path from a production operational application to self-service analytics, and eventually to natural-language questions over governed data. The source system already ran day-to-day workflows and financial activity in Azure Database for PostgreSQL. It was a good application database. It was not an analytical one.
The requirement was broader than a dashboard. Business users needed consistent answers about allocation, utilisation, commitments, trends and operational performance, and they wanted those answers to stay consistent whether they came through Power BI or through a conversational interface later on.
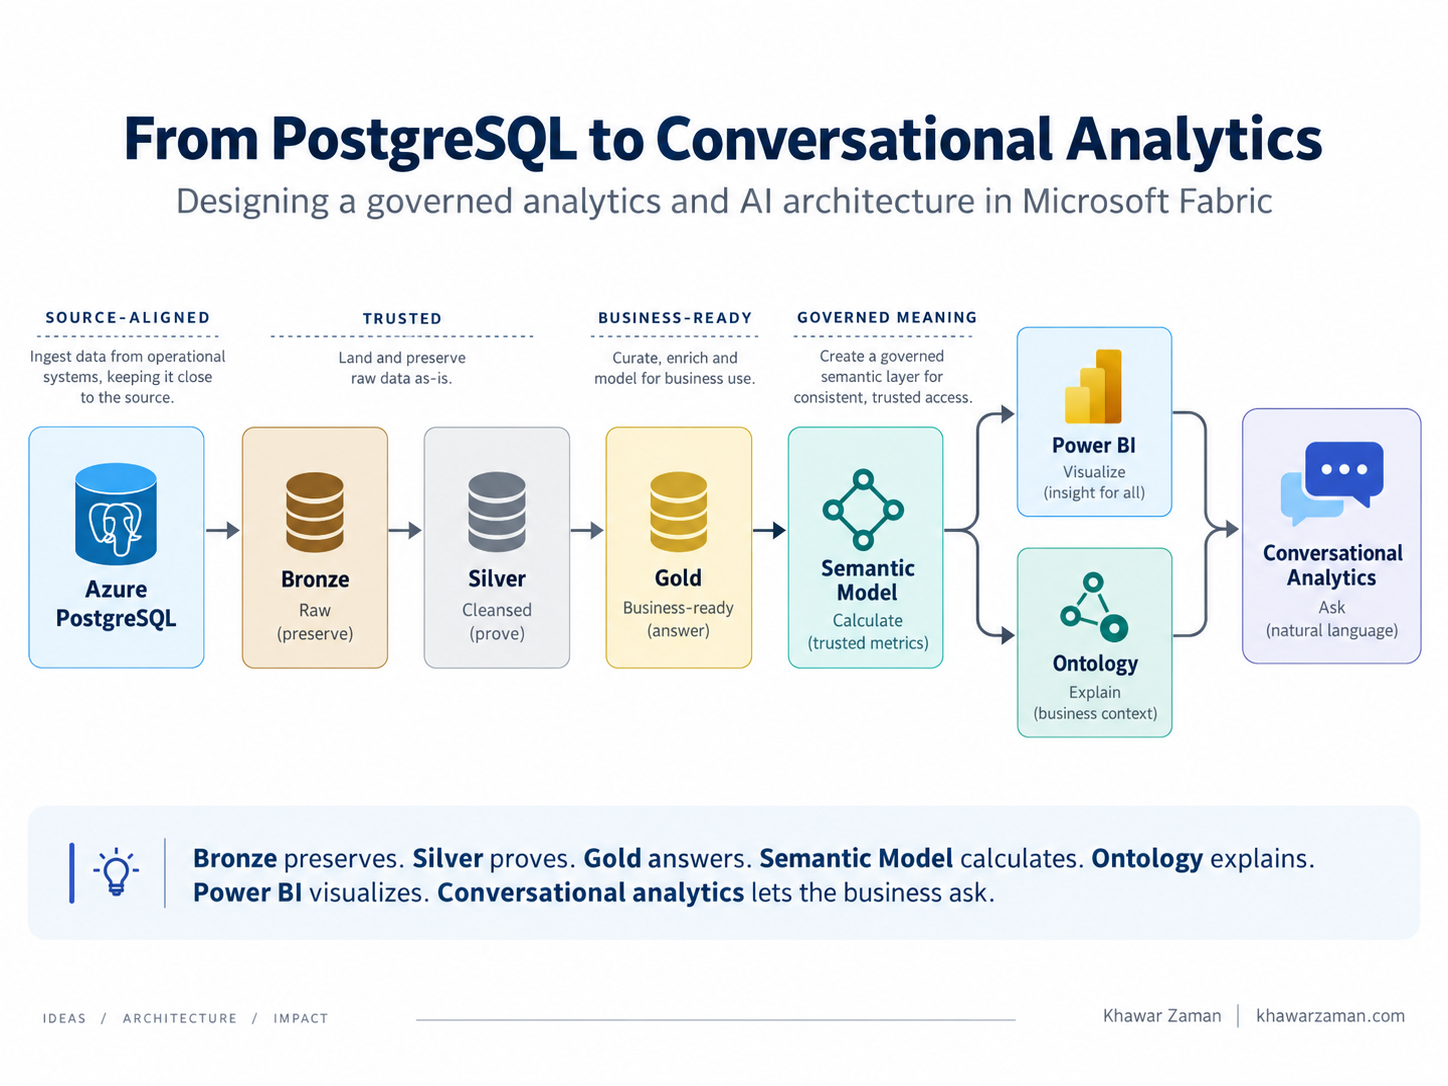
I designed the solution as a layered Microsoft Fabric architecture. Each layer has one responsibility and one quality boundary, and nothing downstream is allowed to redefine what a layer upstream has already settled.
Business names, internal system names, entity labels, identifiers, table names, column names and domain-specific examples have been generalised. The technical architecture and the design decisions are preserved as built.
Why this architecture mattered
A simpler design would have copied the operational tables into a Lakehouse and pointed Power BI at them. Five things about this business made that the wrong answer.
- The operational schema was normalised for transactions and workflows, not for analytical consumption.
- Sensitive and irrelevant operational data should never be landed simply because it exists in the source database.
- Financial analytics needed explicit controls against join fan-out, orphaned relationships and silent reconciliation differences.
- Different reporting calendars could apply to different business agreements, so one generic calendar was not enough.
- Business definitions had to be reusable across reports and conversational experiences rather than recreated in each interface.
What follows is the architecture, in the order I built it, with the decision behind each layer left in.
Start with controlled ingestion, not transformation
The first business requirement was simple: analytics should use only approved operational data. The source database held both business data and application-level data that had no reason to enter the analytical platform.
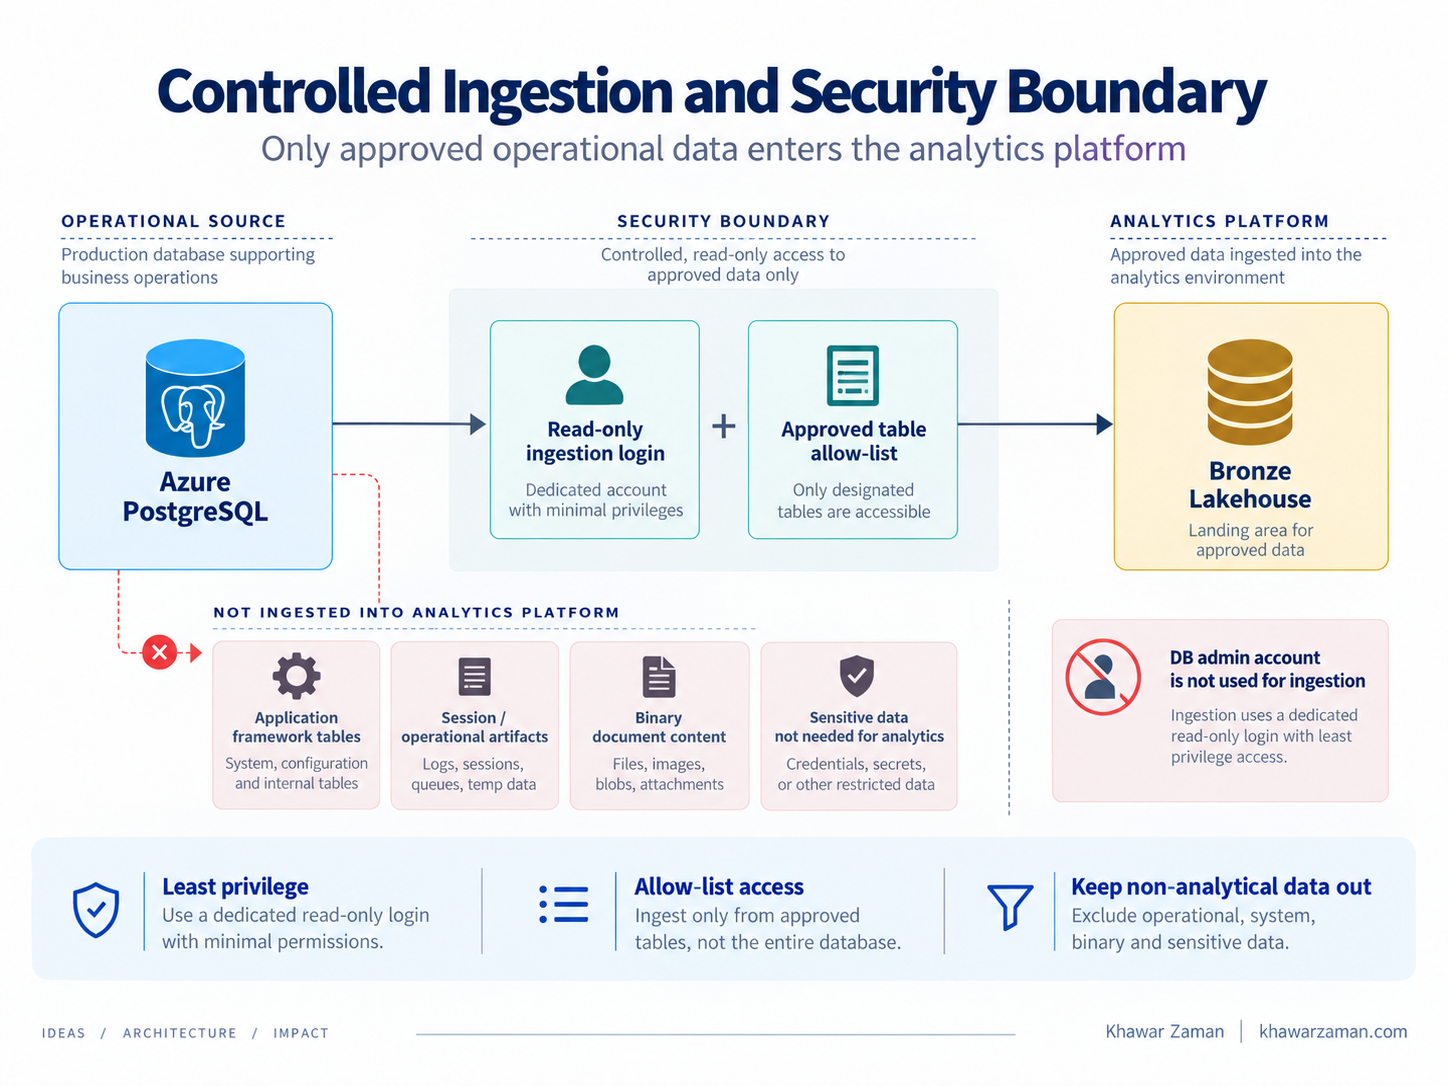
I implemented the access boundary before building any transformation. Fabric connects through a dedicated PostgreSQL login with read-only access to an explicit allow-list of source tables. The database administrator account is not used for ingestion, and never was.
The allow-list is part of the security model
The ingestion identity can read only the approved analytical source tables. The table allow-list is a security control, not a pipeline convenience. Sensitive data, application framework tables, session data, binary document content and operational artifacts that analytics does not need stay outside the Lakehouse entirely.
Permissions are not a one-time setup task. Database migrations can recreate tables, and depending on the deployment pattern that can drop the grants with them. The ingestion runbook therefore includes a readable-table audit after every significant source deployment.
Bronze: preserve the source
The business needed a dependable copy of approved source data in Fabric without changing its meaning. I treated Bronze as a source-aligned, current-state landing layer. It does not clean, rename or interpret anything.
One pipeline, not one per table
Rather than creating a separate Copy Data activity for every table, I used a single parameterised pipeline pattern.
The loop supplies the current table name to both the PostgreSQL source and the Lakehouse destination. Adding an approved table means updating the controlled metadata list, not duplicating pipeline activities. The allow-list and the pipeline are driven by the same list, which is what keeps them from drifting apart.
Why full refresh was the right first choice
The business did not need intra-day change capture, and the source volumes were small. I chose a daily full snapshot with overwrite for the initial implementation.
Incremental / CDC
Often presented as the more advanced design. It brings change detection, update handling, delete handling, merge keys, watermark state and schema-evolution behaviour, none of which the measured volume or refresh window justified.
Daily full snapshot
One overwrite per day. No watermark to lose, no merge to reason about, no deleted-row edge cases. Cheap to run at this volume and trivially easy to prove correct.
Silver: clean and prove the data
The business needed trusted datasets, not another copy of the operational schema. That changed the Silver design significantly. Instead of reproducing every source table, I designed a small number of business-oriented datasets, each with an explicitly declared grain.
Trusted transaction dataset
The first Silver dataset represents one trusted analytical transaction per source activity record. It standardises types, normalises transaction subtypes, preserves the workflow states that matter, applies one consistent occurrence-date convention, and excludes records that should not contribute to active financial reporting.
The critical issue was classification context. The same raw classification code could participate in more than one category context. Joining through the raw code on its own would multiply one transaction into several analytical rows. I resolved classification through the allocation context that actually disambiguates the business meaning.
Trusted allocation dataset
The second Silver dataset represents allocation lines with the descriptive business context already resolved. It carries the business source, the agreement, the operational area, the classification hierarchy and the allocated amount, at one declared allocation-line grain.
Where several source paths could theoretically supply the same label, the transformation uses the relationship that reflects the business rule, not whichever join is easiest to write.
Reporting-period dataset
The business also needed reporting by agreement-specific periods. I added a thin trusted dataset for reporting-period definitions so those windows could be validated once and reused everywhere downstream.
Assertions are part of the architecture
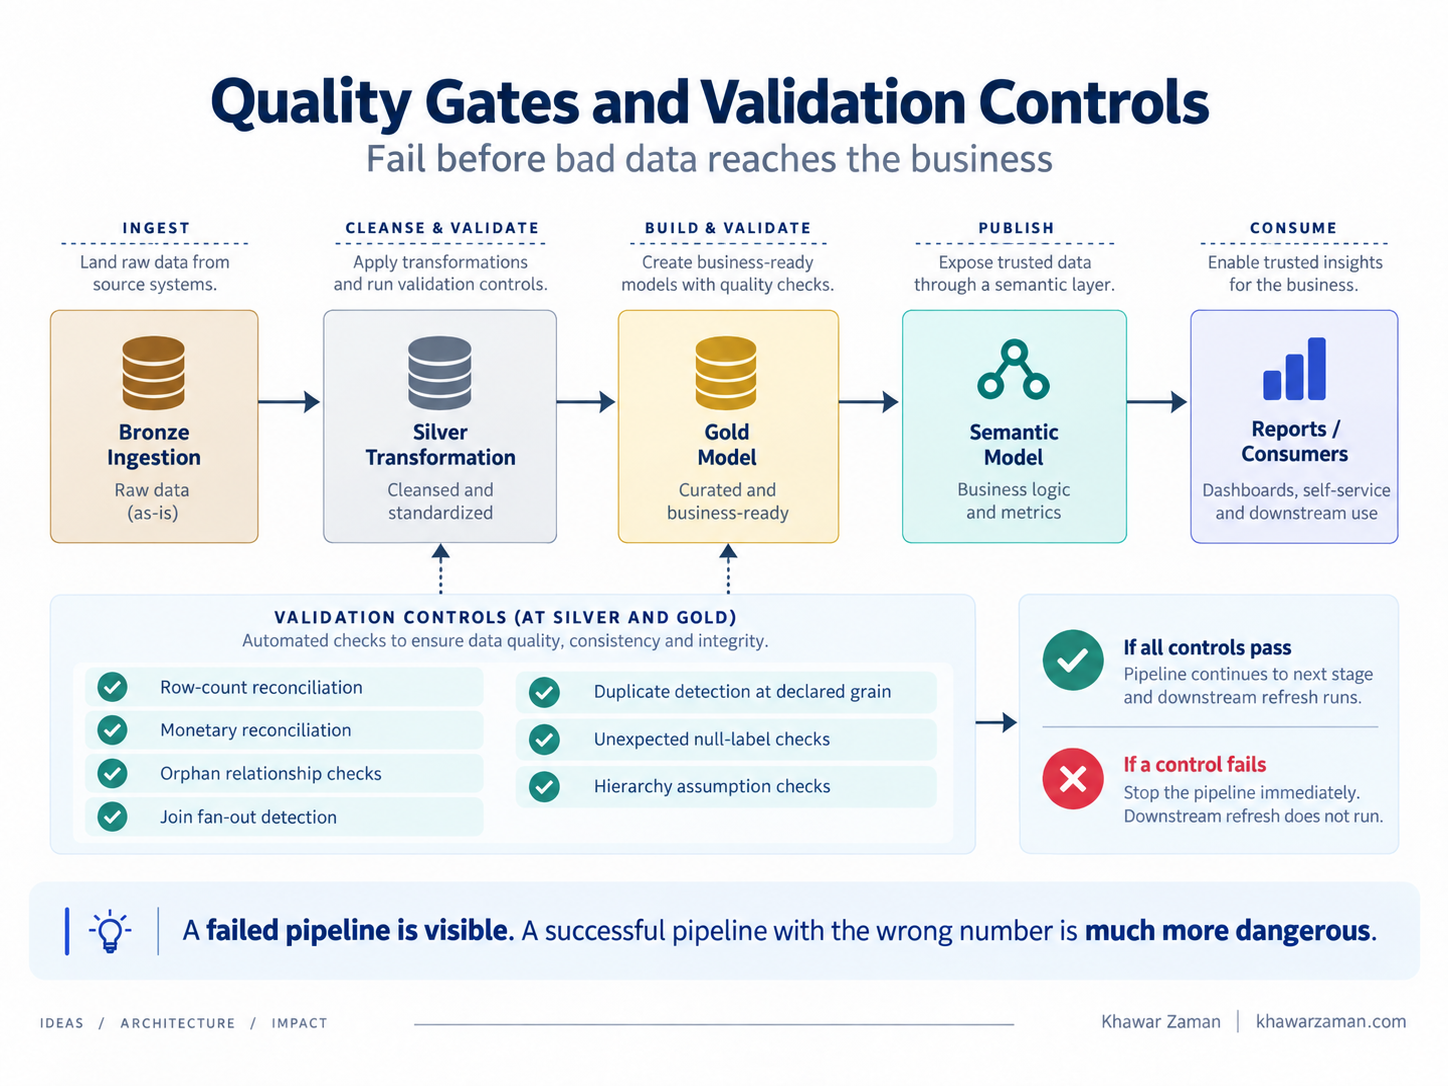
The business needed confidence that analytical totals could be defended. So I treated data-quality assertions as executable architecture rather than documentation. Silver fails the pipeline when any of these controls break.
- Row counts do not reconcile after the documented exclusions.
- Monetary totals do not reconcile to the source, to the cent.
- A required relationship produces orphaned records.
- A join creates unintended fan-out.
- Duplicate rows appear at the declared grain.
- A required business label becomes unexpectedly null.
- A hierarchy assumption used by the analytical model is violated.
Expected source total  =  Trusted Silver total

If false  →  fail the job  →  Gold does not run
Time is not always one calendar
The business needed both organisation-wide time analysis and agreement-specific reporting. Those are different calendars, and forcing them into one definition would have made one of them wrong.
I kept the standard date dimension focused on the organisation calendar. Separately, Gold stamps each applicable transaction with the reporting period determined by its agreement and its occurrence date.
This lets two statements such as activity this organisational fiscal year and activity in reporting period 3 be different, and still both be correct.
Gold: shape the data for questions
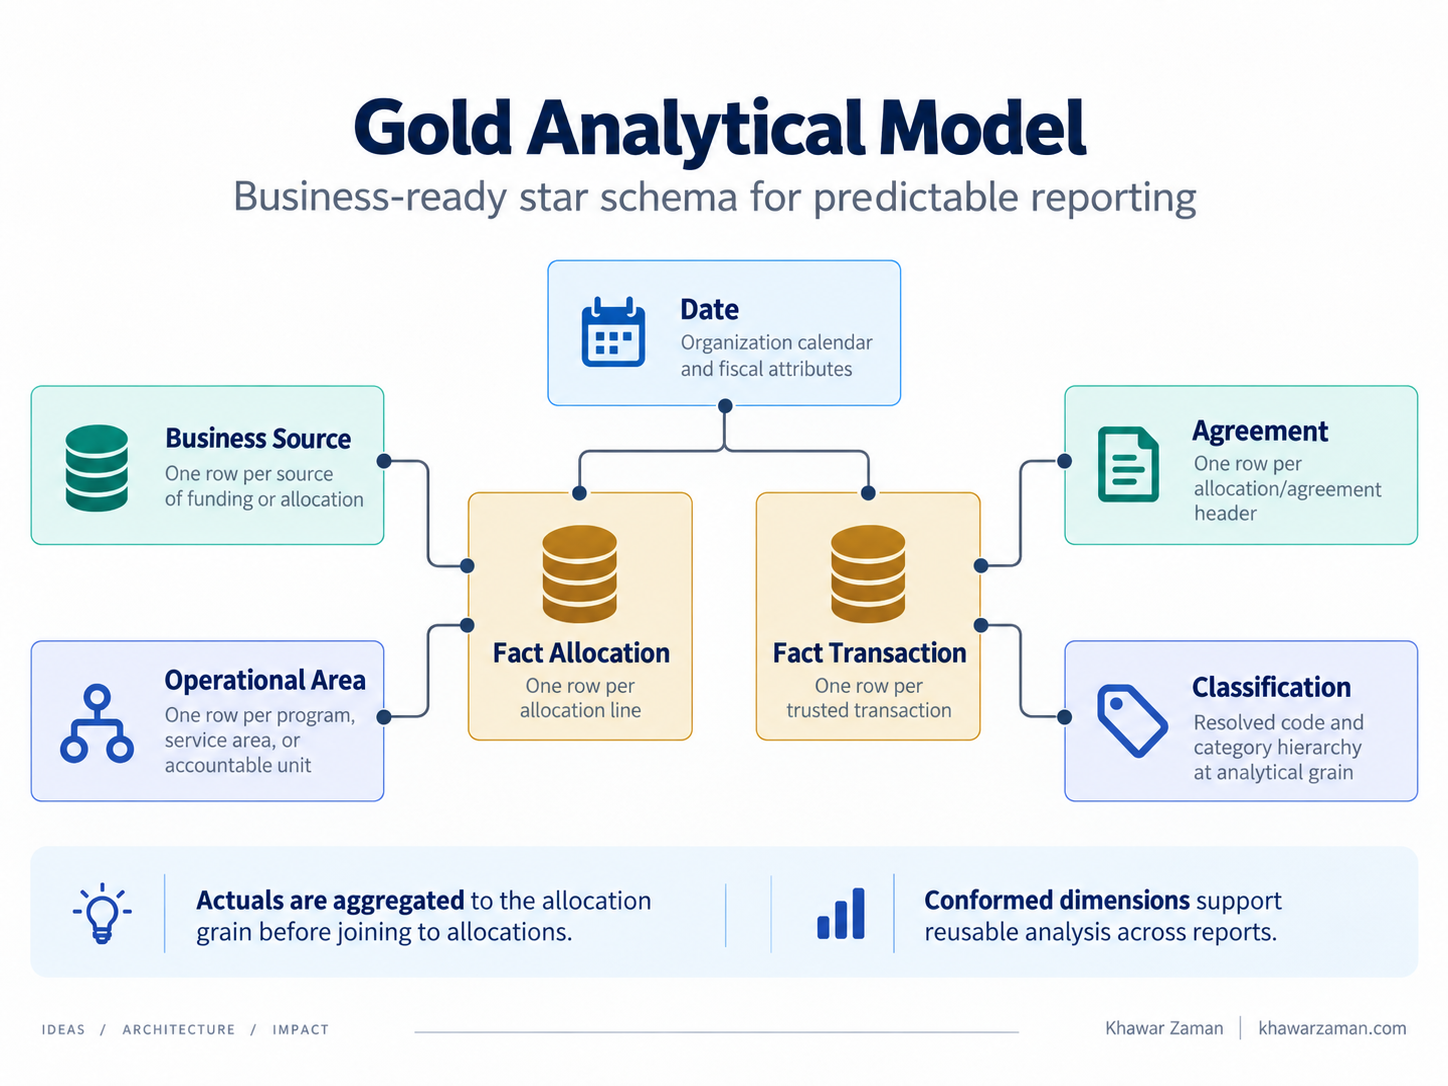
Once Silver is trusted, the business no longer needs to see the operational schema. It needs structures that make the common analytical questions predictable and fast. I designed Gold as a star schema with a small set of conformed dimensions and facts.
| Type | Generic table | Purpose |
|---|---|---|
| Dimension | Date | Organisation calendar and fiscal attributes |
| Dimension | Business source | One row per source of funding or allocation |
| Dimension | Operational area | One row per program, service area or accountable unit |
| Dimension | Agreement | One row per allocation or agreement header |
| Dimension | Classification | Resolved code and category hierarchy at analytical grain |
| Fact | Allocation | One row per allocation line |
| Fact | Transaction | One row per trusted transaction |
A focused business mart
The first materialised Gold mart answers one of the core business questions without report authors having to rebuild transactional logic.
The exact status-to-metric mapping is treated as governed business logic. Transactional detail is retained underneath, so Finance can change a rule later without anyone rebuilding Bronze.
Aggregate before you join
Actuals are aggregated to the allocation grain before joining to allocations. It is a deliberate control, not an optimisation. Joining detail rows to allocation lines and summing afterwards is exactly how a total gets doubled without an error.
Bring forecasting into the governed model
The business also needed forecast-versus-actual analysis. Forecasts were maintained outside the operational application, so I treated them as a separate governed input rather than an informal spreadsheet side process.
Forecast rows must resolve to real analytical entities and valid reporting periods. Unknown codes or identifiers fail validation rather than disappearing silently. Forecast versioning is in from the first load, because revised forecasts are expected over time and the second version should never overwrite the first.
Semantic Model: calculations become reusable
The business needed one definition of each KPI regardless of how many reports were built. I placed the reusable analytical calculations in the Semantic Model instead of rebuilding them on individual Power BI pages.
The model uses simple one-to-many, single-direction relationships from dimensions to facts. Technical keys are hidden where appropriate, and business-facing names, formats, hierarchies and date behaviour are defined once, centrally.
Security has to survive the reporting layer
The business needed users to see only the organisational areas they are authorised to view. I designed dynamic row-level security so the analytical model filters data on the signed-in identity and a governed access mapping, rather than on anything a report author configures.
Broader organisational roles receive explicitly governed all-access mappings. Nobody is all-access by accident.
Publish through a Power BI App, not workspace roles
Business users get the App. They do not get workspace roles, because workspace permissions can change the effective security behaviour of the model. Row-level security that can be bypassed by a permission someone granted for convenience is not row-level security.
Ontology solves a different problem
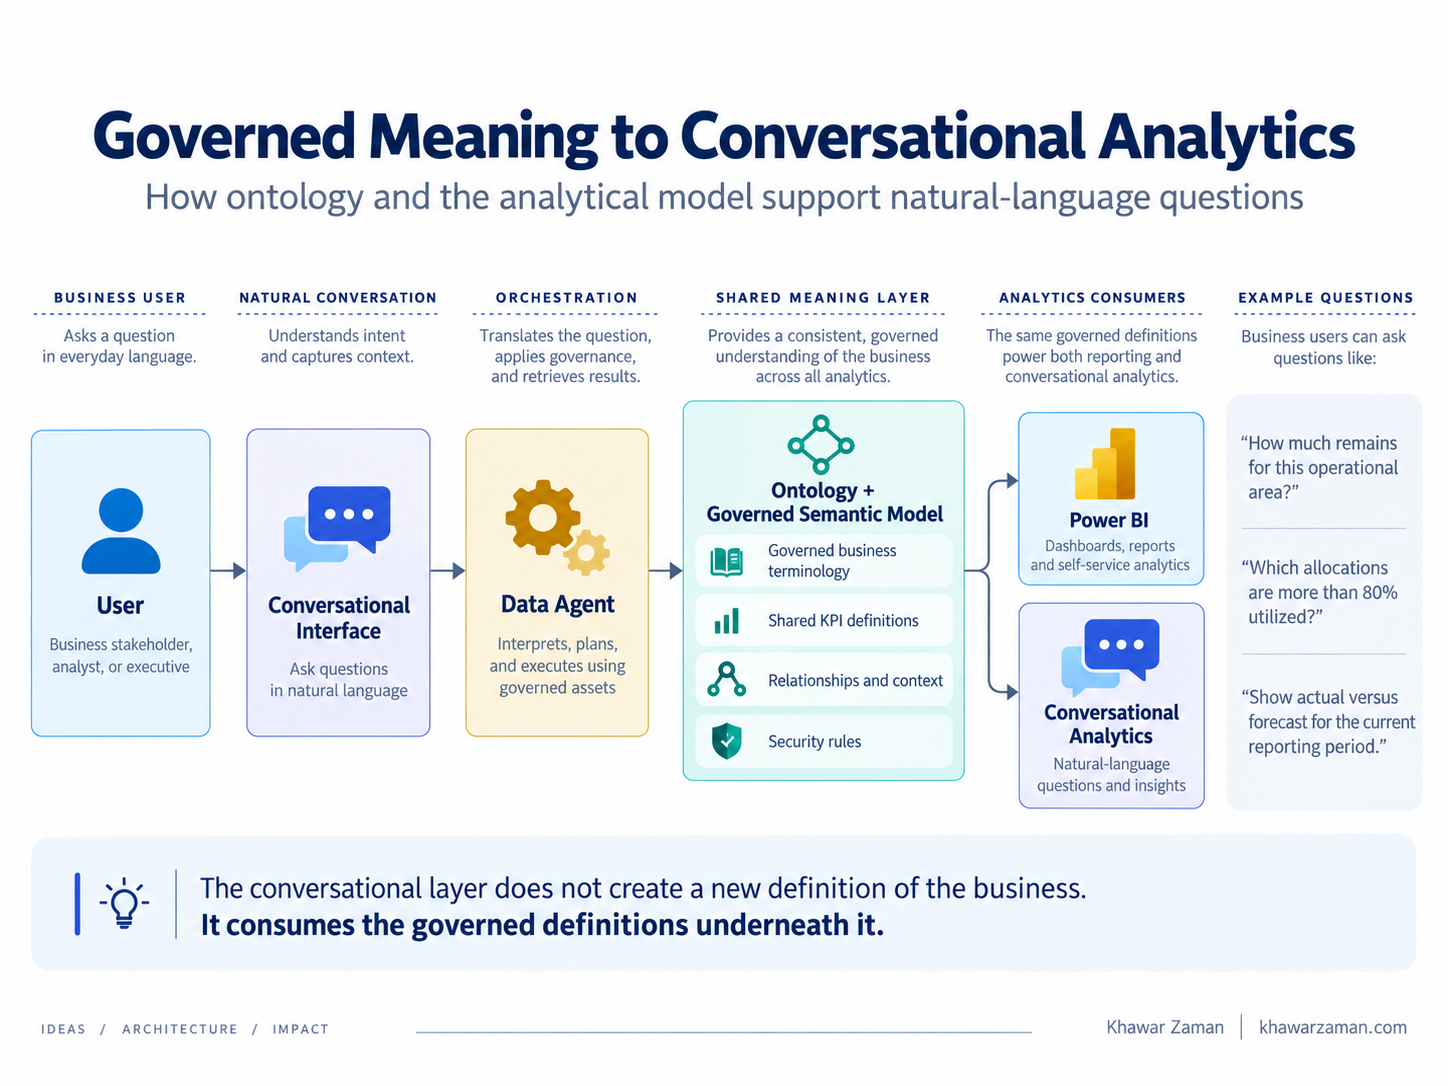
The business ultimately wanted natural-language access to trusted data. For that to work well, an AI system needs more than tables and measures. It needs governed business meaning.
The Semantic Model defines analytical behaviour. The Ontology defines what the business concepts are and how they relate to each other.
Business source  →  provides       →  Agreement
Agreement        →  funds          →  Operational area
Agreement        →  contains       →  Allocation
Transaction      →  consumes       →  Allocation
Transaction      →  classified by  →  Classification
The labels are intentionally generic here, but the design principle is the point. The ontology provides a machine-understandable vocabulary that is bound to governed data, rather than inferred ad hoc from source column names. An agent that guesses what a column means from its name will guess wrong on the columns that matter most.
Power BI becomes a consumer, not the architecture
The business wanted dashboards for allocation, utilisation, trends, forecasting and drill-through analysis. By the time Power BI is introduced, the difficult decisions should already be encoded upstream.
Report authors should not need to understand the PostgreSQL schema, source foreign keys, classification ambiguity, workflow-state rules, reporting-period logic or reconciliation controls. If they do, the architecture has leaked.
Typical report questions
- How much is allocated, spent, committed and remaining?
- Which areas are approaching their allocation limits?
- How is activity trending over time?
- Which classifications drive the largest amounts?
- How does forecast compare with actual for the current reporting period?
- Where should users drill from summary to transaction detail?
Conversational analytics: let the business ask
The final business goal was not to make users learn Fabric. It was to let them ask governed business questions in natural language, and get the same answer Power BI would have given.
“How much remains for this operational area?” · “Which allocations are more than 80% utilised?” · “What is committed but not yet confirmed?” · “Show actual versus forecast for the current reporting period.”
The user should not need to know SQL, DAX, Lakehouse table names, foreign keys, fact tables or dimension tables.
Fail before the user sees the problem
The production pipeline chains the layers so that downstream consumers refresh only when the upstream quality gates pass.
Daily trigger
    ↓
Bronze ingestion + validation
    ↓
Silver transformation + assertions
    ↓
Gold transformation + reconciliation
    ↓
Semantic Model refresh
    ↓
Power BI  /  Ontology  /  Conversational analytics
Bad Bronze → stop. Bad Silver → stop. Bad Gold → stop. A stale dashboard with yesterday’s correct number is a better outcome than a fresh one with today’s wrong number.
What this changes compared with a typical Fabric tutorial
A product tutorial can show how to copy data into a Lakehouse and build a report. A production architecture has to answer a different set of questions before any of that is worth doing.
- Which source data should the platform be allowed to see?Answered by the read-only identity and the table allow-list.
- When is full refresh better than incremental complexity?Answered by measuring volume and refresh window, not by preference.
- What exactly is the grain of each trusted dataset?Declared per Silver dataset and asserted on every run.
- Which relationship represents the real business meaning?Resolved through allocation context, not the easiest join.
- How do we detect fan-out before it reaches a report?Row-count and monetary reconciliation that fail the job.
- Which calendar applies to which question?Organisation calendar in the date dimension, agreement periods stamped in Gold.
- Where do shared business calculations belong?In the Semantic Model, once.
- How does analytical security inherit organisational access rules?Dynamic RLS on a governed access mapping, distributed through an App.
- How does AI use the same governed meaning as Power BI?Through an Ontology bound to the same model.
Those questions are the architecture. Microsoft Fabric provides the implementation capabilities.
The larger lesson
The difficult part was not moving PostgreSQL tables into OneLake. The difficult part was building a chain of trust from an operational event to a business answer.
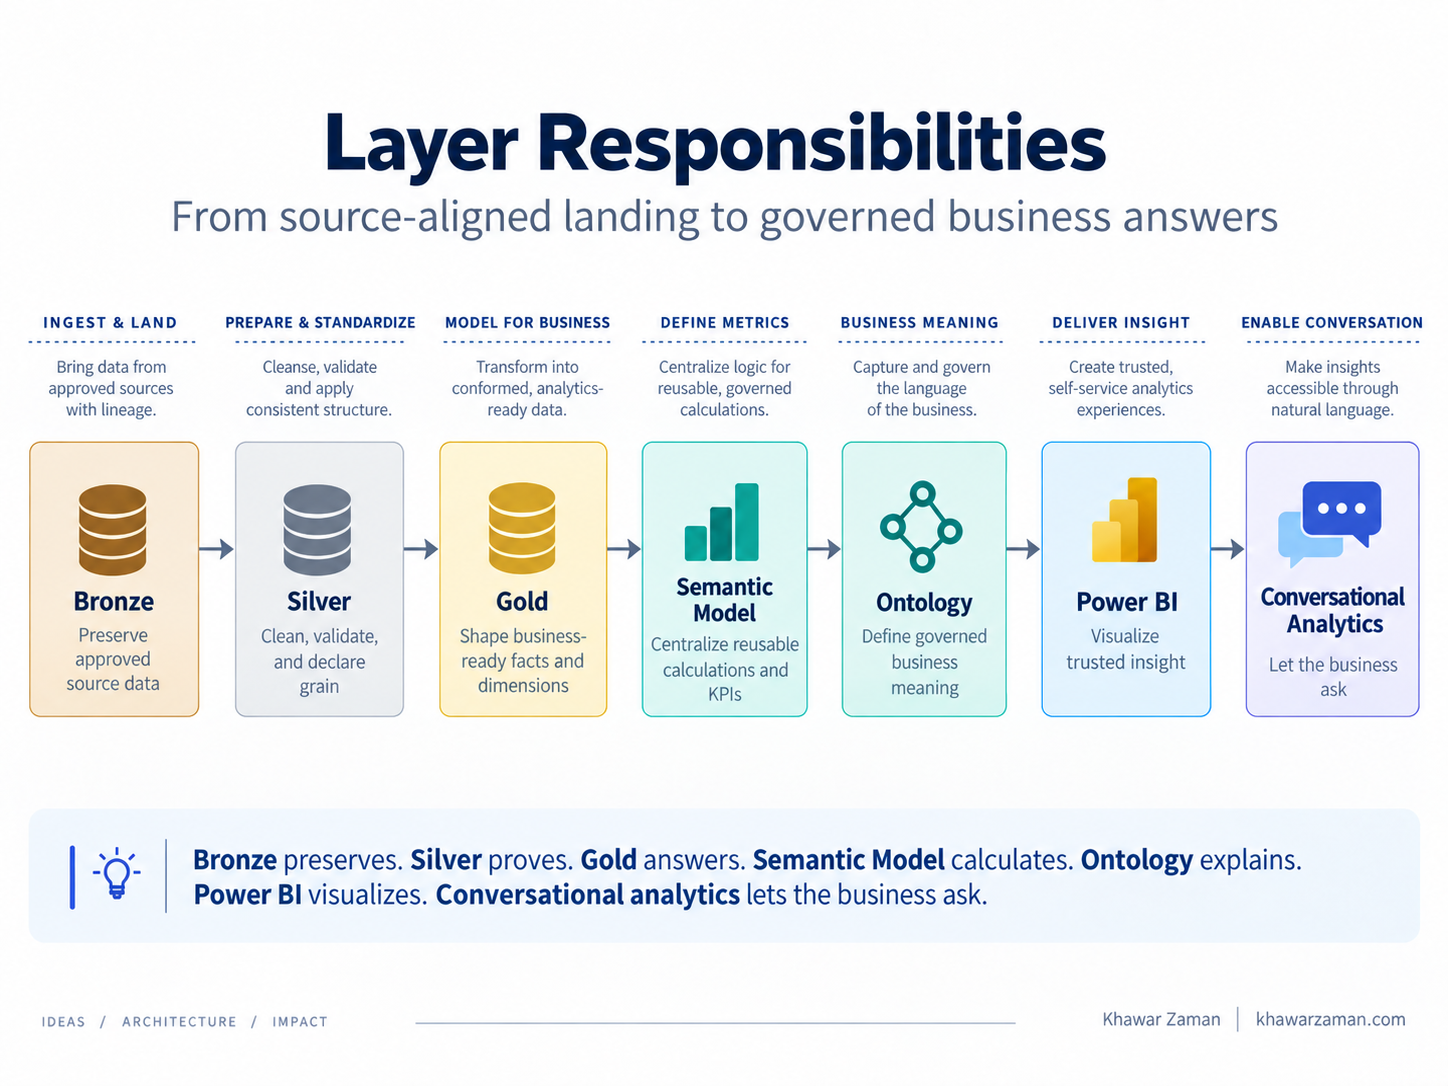
Bronze removes uncertainty about what was ingested. Silver removes uncertainty about whether the data is clean and correctly related. Gold removes uncertainty about analytical shape. The Semantic Model removes uncertainty about calculations. The Ontology removes uncertainty about terminology and relationships.
Only then does conversational analytics become genuinely useful. The goal is not to let an AI query a database. The goal is to let a user ask a business question and receive an answer that has already passed through every control a production analytical system is expected to have.